Notes from ACM Webinar on blockchain (etc.)

The Next Radical Internet Transformation: How Blockchain Technology is Transforming Business, Governments, Computing, and Security Models

Speaker: Mark Mueller-Eberstein, CEO & Founder at Adgetec Corporation, Professor at Rutgers University, Senior Research Fellow at QIIR

Moderator: Toufi Saliba, CEO, PrivacyShell and Chair of the ACM PB Conference Committee

Warning: These are notes taken live. Errors and omissions will occur. No responsibility whatsoever.

  • intro: old enough to remember the discussions in the early 90s about how the internet would change mail services – completely forgetting shopping, entertainment and others
  • Blockchain solves the problem of transferring value between Internet users without a third party
  • goes beyond the financial industry, can handle any kind of transaction
  • most of the world has access to a mobile phone, only about 20% has access to the banking system
  • Blockchain is the banking industry’s Uber movement
  • Blockchain much wider than Bitcoin, will facilitate new business models.
  • Blockchain transfers rather than copies digital assets, making sure there is only one instance of it.
    • settlement process: no clearing houses or central exchanges
    • peer-to-peer transfers, validation by network
  • Example: WeChat taking over payments in China, no link to banks
  • many commercial or government services are basically “databases” that are centrally managed, with one central point of failure
  • Blockchain allows a distributed ledger, information put in cannot be changed
    • Estonia thinking about a Blockchain in case of hacking or occupation
  • public (open), private and government blockchainsxx1
  • allows new services to existing customers, lots of inefficiencies up for grabs
    • estate records, voting, domain control, escrow, etc…
    • iPayYou allows use of Bitcoin
    • Walt Disney looking at Blockchain (DragonChain) for internal transfers, also use it for tracking supply chain to their cruise ships. Opensourced it.
  • 80% of Bitcoin mining done in China
  • regulation comes with a cost
  • Shenzhen want to be Blockchain Tech capital
  • 6-level security model, developed by William Mougayar (goes through it in detail: transaction, account, programming, distributed organizations, network (51% attacks, perhaps as low as 30%, smaller blockchains more vulnerable), governance)
  • Ethereum blockchain focusing on smart contracts: Hard forked in 2016, DAO issue where somebody hacked DAO code to siphon off money, hacking the program using the blockchain (not the blockchain),
  • credit card transaction can take up to 30 days, with disputes and everthing, Blockchain is almost instant
  • How “real” is blockchain technology
    • Goldman-Sachs invested $500m+
    • 15% of top global banks intend to roll out full-scale, commercial blockchain
    • etc.
  • what is holding it back?
    • difficult to use, understand, buy in; perception of risk and legality
    • difficult to see value for the individual
  • questions:
    • what are the incentives and adoption models?
      • different philosophies: computing power must be made available in the network: industrial mining vs. BitTorrent model, the amount of computing provided will be important, if we can find a model where just a little bit from every mobile phone is required
    • what are the hard costs of Blockchain?
      • you can google the costs. There are other approaches being developed, will post some links
    • can Blockchain be compromized by a virus?
      • theoretically, yes. Bitcoin is 10 years without, open source means verification (change is happening slowly because of code inspection)
      • comes back to incentive and governance model
  • and that was that…recording will be at webinar.acm.org in a few days.

Case teaching in Vienna

quantI have been asked to give a keynote speech at a conference on case teaching in Vienna, at the The University of Applied Sciences BFI. This is quite an honor, and I am very much looking forward to it.

Should you happen to want to be in Vienna and focus on case teaching on May 19 – well, I hope to see you there!

SmartHelp – geolocation for crisis situations

I am on the board of SmartHelp – a platform for crisis communication for emergency services (or, indeed, for any company that needs to locate its assets or employees in a hurry). The platform has been running in production in two emergency services (fire and ambulance) in Trondheim, Norway, since December 2014. It allows the public to contact the emergency service via a Smartphone interface, give precise details about where they are automatically, and also to chat and share their medical information (fully encrypted up to a medical standard.)

Here is a video demonstrating how the system works:

We are currently seeking partners for marketing and further developing this platform outside the Norwegian emergency service market. Please contact me (self@espen.com, +47 4641 0452) or Fredrik Øvergård, CEO (fredrik@radvice.no, +47 977 32 708)  for further information.

Effective student feedback

In our book Teaching with cases: A practical guide, Bill Schiano and I talk at a fairly high level about how to give effective student feedback by using a spreadsheet and personalized emails. Our argument is that by giving every student individual feedback in addition to the grade, you reduce the number of grade justification requests and complaints. This blog post is a detailed guide on how to do it – too detailed for the technically inclined, probably, but we all have to start somewhere.

You probably already have all the tools you need on your computer – a spreadsheet and an email client that works with your spreadsheet – such as Excel and Outlook, for example. (For myself, I use Excel and SerialMailer, a cheap serial mail client for Mac.) You can probably use online software as well, for instance a Google spreadsheet (which is nice because editing by more than one teacher is easy) and Gmail, though I have never tried it.

The idea is to use the spreadsheet to organize all your feedback, and to set it up so you use as little time as possible to give as much feedback as possible. I will demonstrate this, with an example for a fictitious course with three in-class sessions (with participation grading, 40% of grade), an individual written examination (30% of grade), and a group assignment (30%). I will show the various details of building the spreadsheet below – if you want to skip ahead and inspect the thing your self, I have made it available for downloading.

I start with a spreadsheet of students and email addresses, provided to me by the administration or downloaded from our LMS. Let’s say it looks something like this:

1eval

(If I have the time or can get the administration to create it from their databases, I ask to have first and last names in separate columns. For this demonstration, I won’t bother.)

Then I add columns for each of the assignments that I am going to grade:

2eval

(In this example, the individual examination has six questions, of which the students should answer four.)

For the group project, I create a separate sheet (in the same workbook, called “Groups”

3eval

The group sheet is exceptionally simple, just group number, points and comment. If you have several group assignments, this is where you will put them:

4eval

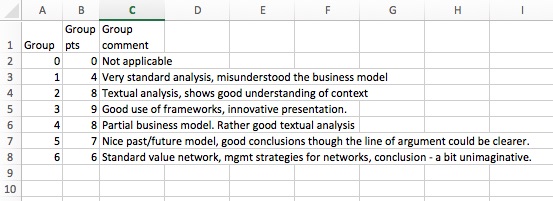
Note that I also create a group numbered 0. This is what I use for students who drop the course or don’t do the group assignment.

With that done, I assign students to groups in the Students sheet…

5eval.jpg

…and then I am ready to start teaching my course.

As the course rolls along, I enter points and comments for each student. As mentioned in the book, it is extremely important that you do the participation evaluation immediately after each class. I tend to give the students a score of 1-3, sometimes 1-6, with some definition. As I will show later, what scale you use does not really matter, as you can normalize them to whatever you want later in the process.

Anyway, assume the course is finished, and you have entered comments and points for everything – for the individual student, in the Student sheet….

7eval.jpg

…for the groups, in the Groups sheet:

6eval

To finish the evaluation part (we’ll get to communication later), you need to a) match the group points and comments to each individual student, b) calculate a final score for each student, and c) determine the letter grade for each student.

First: Group grades and comments. For a small class like this, this is probably a bit of overkill – you could just copy comments and points over to each individual student. But doing it the way I show here has the advantage (aside from being correct from a database administrator’s point of view) of error-correction (any error you make will be systematic and therefore easily spotted) and repeatable (the first time you do this, it is a chore, the second time, you just copy your previous spreadsheet and fiddle with it). Moreover, if you have a class with more than 40 students, a bit of “programming” saves time and effort. (I have done this for classes of 350 students, a situation where participation grading is not really possible – except as a small reward for exceptional students – but where the group feedback mechanism becomes extremely valuable.)

So, first – link individual students with their group’s scores and comments, using the LOOKUP function:

8eval

The formula is

           =LOOKUP($E2;Groups!$A$2:$A$8;Groups!B$2:B$8)

and what it does is take the student’s group number (E2), look it up the first column of the “Groups” sheet (Groups!$A$2:$A$8), using fixed references to be able to copy the formula to the rest of the sheet, and displaying the group score (which is in column Groups!$B2:$B8). This nicely picks up all the group scores and comments:

9eval

We now have all the information for each student, then we have to calculate the various scores. We have the exam score already (the average of the exam points) and the participation score (a sum of the score for each session.) We now need to calculate the total points, which isn’t too hard: The max for participation is 9, for the others it is 10, so the formula for the total will be:

01eval

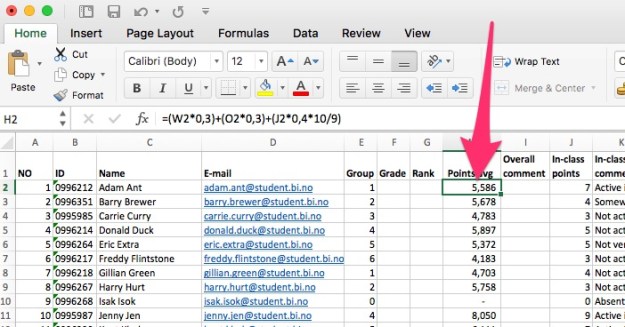
         =(W2*0,3)+(O2*0,3)+(J2*0,4*10/9)

(I use comma as a decimal delimiter, parentheses for readability). We can now add a student ranking in the G column (students are always interested in this, so why not tell them?)

02eval

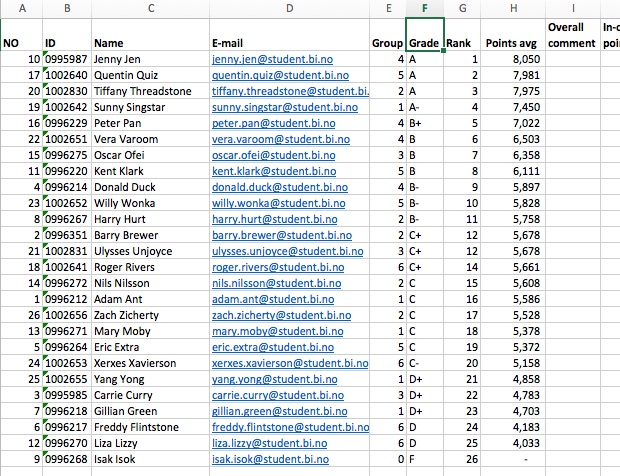
Now we are ready to set the grades. The simple way to do this is to sort the students by their scores (or rank, if you will):

03eval

How you set the letter grades is up to you, of course, but it helps to have the students sorted. I set grades by starting at the top, trying to get a reasonable distribution, and make sure that I don’t use absolutes so that some unlucky student narrowly misses a better grade. Let’s say we end up here:

04eval

Now we are ready to communicate the results to the students. We will do that by writing a letter to them, composed largely of common text (i.e., feedback that is the same to all students), and them use the mail/merge function of word to merge in the individual details from the spreadsheet.

1feed

Example letter using SerialMailer

As said above, I use a product called SerialMailer on my Mac. The concept is simple: You write the letter, link to the spreadsheet, and insert field names into the text. When the letter is sent out (or printed), the field names are substituted for the values for each individual student.

Here is how to do it in Word (if you want to send it out via email, you need to have Outlook as well.):

First, open Word and write the letter:

2feed

(As you can see, I recycle much of my texts…)

Let’s start by replacing “student” in the opening salutation with the student’s name. Then you open the Mailings tab in Word and hit Select recipients from an existing list…

3feed

…and select your spreadsheet:

000ff

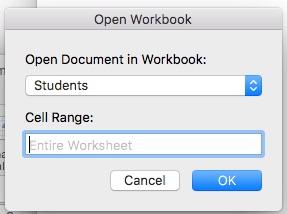
I get this message, click OK:

5feed

And open the “Students” sheet (i.e. the individual sheet):

6feed

If you click “Insert Merge Field” now, you should get a list of the column headings in the spreadsheet:

7feed

Delete the word “student”, choose “Insert Merge Field” and choose “Name”, and the field code will be in the document:

8feed

If you hit “Preview Results”, the code will be replaced by the content for each student:

9feed

Now write field labels and insert the fields you want to share with the students. I like to add the listing at the end of the letter, but you can do whatever you want:

1ff

Hit Preview, and this is what each student will see:

2ff

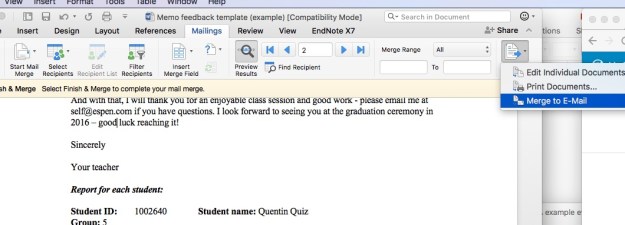
And there you go. Now hit “Finish and Mail Merge”, and select whether you want to print the documents on paper (or PDF) or send them out via email (shown).

3ff

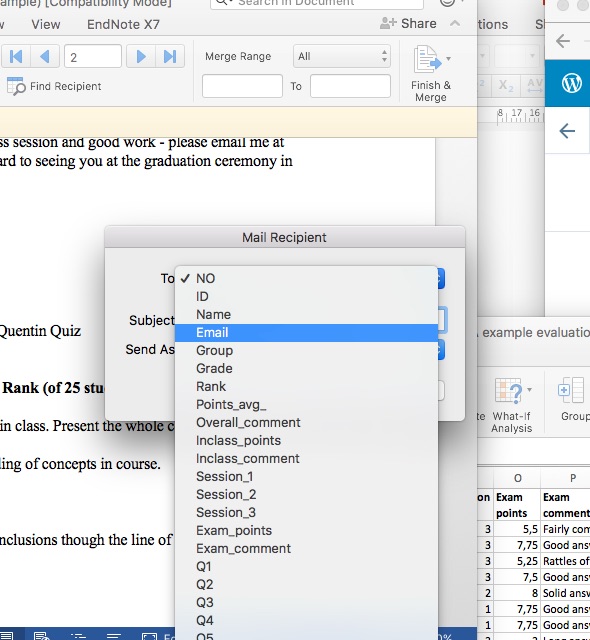
You must tell Outlook where the email addresses are in the spreadsheet:

5ff

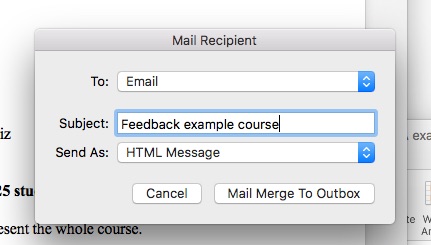
Then specify a subject and choose HTML Message (if you want formatted text):

6ff

…and, well, this is where I will have to stop, since I do not use Outlook. But trust me, it works well, the students love having individualized feedback, and it really isn’t that much more work than just providing the grade. As an added bonus: If students want a grade justification, you can just tell them that they already have it…

(Corrections and feedback welcome, of course.)

Singularity redux

From Danny Hillis: The Pattern on the Stone, which I am currently reading hunting for simple explanations of technological things:

Because computers can do some things that seem very much like human thinking, people often worry that they are threatening our unique position as rational beings, and there are some who seek reassurance in mathematical proofs of the limits of computers. There have been analogous controversies in human history. It was once considered important that the Earth be at the center of the universe, and our imagined position at the center was emblematic of our worth. The discovery that we occupied no central position – that  our planet was just one of a number of planets in orbit around the Sun – was deeply disturbing to many people at the time, and the philosophical implications of astronomy became a topic of heated debate. A similar controversy arose over evolutionary theory, which also appeared as a threat to humankind’s uniqueness. At the root of these earlier philosophical rises was a misplaced judgment of the source of human worth. I am convinced that most of the current philosophical discussions about the limits of computers are based on a similar misjudgment.

And that, I think, is one way to think about the future and intelligence, natural and artificial. Works for me, for now. No idea, of course, whether this still is Danny’s position, but I rather think it is.

Key myths about analytics

My excellent colleagues Alessandra Luzzi and Chandler Johnson have pointed me to this video, a keynote speech from 2015 by Ken Rudin, head of analytics at Facebook:

This is a really good speech, and almost an advertisement for our course Analytics for Strategic Management, which starts in two days (and, well, sorry, it is full, but will be arranged again next year.)

In the talk (starting about 1:30 in), Ken breaks down four common myths surrounding Big Data:

  1. Big Data does not necessarily imply use of certain tools, in particular Hadoop. Hadoop can sift through mountains of data, but other tools, such as relational databases, are better at ad hoc analysis once you have structured the data and determined what of the data that is interesting and worth analyzing.
  2. Big Data does not always provide better answers. Big Data will give you more answers, but, as Rudin says, can give you “brilliant answers to questions that no one cares about.” He stated the best way to better answers to formulate better question, which requires hiring smart people with “business savvy” who will ask how to solve real business problems. Also, you need to place the data analysts out in the organization, so they understand how the business runs and what is important. He advocates an embedded model – centrally organized analysts sitting geographically with the people they are helping.
  3. Data Science is not all science. A lot of data science has an “art” to it, and you have to have a balance. Having a common language between business and analytics is important here – and Facebook sends its people to a two-week “Data Camp” to learn that. You ned to avoid the “hippo” problem – the highest paid person’s opinion – essentially, not enough science. The other side is the “groundhog” issue – based on the movie – where the main character tries to win the girl by gradual experimentation. Data is like sandpaper – it cannot create a good idea, but it can shape it after it has been created.
  4. The goal of analytics is not insights, but results. To that end, data scientists have to help making sure that people act on the analysis, not just inform them. “An actionable insight that nobody acts on has no value.”

To the students we’ll meet on Tuesday: This is not a bad way of gearing up for the course. To anyone else interested in analytics and Big Data: This video is recommended.

(And if you think, like I do, that his sounds like the discussion of what IT should be in an organization 20 years ago – well, fantastic, then we know what problems to expect and how to act on them.)

Hans Rosling in memoriam

Hans Rosling died from cancer this morning.

Not much to say, really. Or, maybe, so much to say. I met him in Oslo once, I had seen his video and suggested him for the annual “big” conference for movers and shakers in Oslo. He came and wowed everyone. Simple as that.

Here is another one (this one in Swedish) where he just shuts down a rather snooty and ill prepared newsshow host by saying, essentially, “this is not a matter of opinion, this is a matter of statistics and facts. I am right and you are wrong.”

What a man.

Teaching hacks: Getting rid of those long links

I find myself having to ask students to look up web pages and online materials in various forms all the time. Often, the links are quite long and not very intuitive. The way to fix that is to use a URL (Uniform Resource Locator, fancy name for web address) to turn, for instance

into

  • goo.gl/1kfvfzqr1

which is undeniably shorter and easier to write down fast. I can also make it into a QR code which can be scanned by the students from a PowerPoint slide and brought up on their smartphones.

There are a number of such URL shorteners – goo.gl, bitly.com, TinyURL, and so on. I use goo.gl, but after a tip from Ragnvald Sannes I have installed it as an extension of my Chrome browser, which means that whenever I want to share a link to many people I go to the page in question, click on the URL shortener in the top line of the browser, and that’s that. (There probably are similar extensions available for your browser of choice, go search.)

Quite a little timesaver…

If you want to read more about URL shorteners, try the Wikipedia article (which also lists some of the technical issues that sometimes crop up, though not much in a teaching context.)

Teaching hacks: Write next year’s course this year

As a teacher, you tend to have the same courses year after year. I have 5-6 courses I repeat in various shapes and forms. To keep them fresh, they need to be updated every year – new materials, purge stuff that has gone stale or didn’t work, and so on.

My problem is that as soon as I have finished teaching a course, I completely forget about it until the next time (normally a year later), and then have to scramble to update things and find new literature. While you are teaching the course, you notice things that don’t fly, but then you forget the details.

gra6834-2017_-_google_driveThe hack, of course, is simple: Write next year’s course documentation as you are teaching this year’s course. For instance: I have a detailed syllabus (written as a Google Doc) for my course GRA834 Business Development and Innovation Management (which I last taught in the fall of 2016). The syllabus is largely the same from year to year, but when I start teaching the course, I make a new copy of document (as the figure shows, the whole course folder), and fiddle with it after each class. For stuff I will have to change later, I make a note to myself, inserting the text “zxzx” which I can search. When the course starts next year, I simply make the edited documents available to the students straight into It’s Learning (the course management system we use at BI.)

Not exactly rocket science, but the hack is doing this as you start teaching. Much less hassle the next year…

(PS: You can do similar things with presentations and other stuff: My eminent colleague Hanno Roberts has a hidden slide in the back of all his presentations, where he writes notes to himself about what he will need to change the next time he gives it.)

Teaching Hacks: Using Google Docs under It’s Learning

(This is a new category I just dreamed up – will post little snippets of useful stuff for teaching. My view is that technology should make your life easier and the experience of the student better – otherwise, don’t use the technology.)

At BI Norwegian School of Business we use a learning management system called It’s Learning. As these systems go, it is (I think) no better or worse than any other system, but the interface is a bit clunky. However, it has a very useful feature (which I learned from Ragnvald Sannes), namely the ability to display Google Docs within the page:

screendocs

This is very useful because

  • you can create all your course documents (syllabi etc.) in Google Docs, which is much better for editing and everything else. You can even edit the docs right in the It’s Learning window.
  • you can give the students read, comment or write capability as you please. Giving the students write access to a shared document is useful for many purposes – I use it as a shared arena for proposing term papers, for instance. Linda Rademaker uses a shared spreadsheet for student group formation – the students write themselves into groups, and she has a tab with “Lost sheep” who have not found groups to work in.
  • you can also share a Google Folder with the students and link that right from It’s Learning.

To set up a page like this, first create the document in Google Drive, copy the link to the document (“Share” in Google Doc, set the access rights to whatever you want), go to It’s Learning, click “Add” in the left column, choose “File or link”. Here you can choose various options, but what has worked for me is choosing “link” and pasting in the link. Make sure the “Embed page within itslearning” is checked, write the Title, and there you go.

Certainly has made my life easier, and hopefully made the students’ experience better.

(By the way, this does not work in China, of course (no Google Doc access), in case you teach there.)

Rodrigo y Gabriela, again

I think you need to get about halfway through this one to really appreciate it…

Walking video, again

BI seems to have a thing for walking videos – this time I was roped in to walk from the lecture hall to the entrance at the Fudan School of Management. The video continues with Ragnhild Silkoset from BI, Wang Xiaozu from Fudan, and Jan Ketil Arnulf from BI.

The idea is that we “walk” from Shanghai to Oslo, showcasing the 20 year cooperation between Fudan and BI.

And what you don’t see is that it was over 30 degrees in Shanghai that day, and I was sweating buckets in my wool suit…

Analytics for Strategic Management

I am starting a new executive course, Analytics for Strategic Management, with my young and very talented colleagues Alessandra Luzzi and Chandler Johnson (both with the Center for Digitization at BI Norwegian Business School).

alessandra

Alessandra Luzzi

chandler

Chandler Johnson

The course (over five modules) is aimed at managers who want to become sophisticated consumers of analytics (be it Big Data or the more regular kind). The idea is to learn just enough analytics that you know what to ask for, where the pressure points are (so you do not ask for things that cannot be done or will be prohibitively expensive). The participants will learn from cases, discussions, live examples and assignments.

Central to the course is a course analytics project, where the participants will seek out data from their own company (or, since it will be group work, someone else’s), figure out what you can do with the data, and end up, if not with a finished analysis (that might happen), at least with a well developed project specification.

The course will contain quite a bit of analytics – including a spot of Phython and R programming – again, so that the executives taking it will know what they are asking for and what is being done.

We were a bit nervous about offering this course – a technically oriented course with a February startup date. The response, however, has been excellent, with more than 20 students signed up already. In fact, wi will probably be capping the course at 30 participants, simply because it is the first time we are teaching it, and we are conscious that for the first time, 30 is more than enough, as we will be doing everything for the first time and undoubtedly change many things as we go along.

If you can’t do the course this year – here are a few stating pointers to whet your appetite:

  • Big Data is difficult to define. This is always the case with fashionable monikers – for instance, how big is “big”? – but good ol’ Wikipedia comes to the rescue, with an excellent introductory article on the concept. For me, Big Data has always been about having the entire data set instead of a sample (i.e., n = p), but I can certainly see the other dimensions of delineation suggested here.
  • Data analytics can be very profitable (PDF), but few companies manage to really mine their data for insights and actions. That’s great – more upside for those who really wants to do it!
  • Data may be big but often is bad, causing data scientists to spend most of their time fixing errors, cleaning things up and, in general, preparing for analytics rather than the analysis itself. Sometimes you can almost smell that the data is bad – I recommend The Quartz guide to bad data as a great list of indicators that something is amiss.
  • Data scientists are few, far between and expensive. There is a severe shortage of people with data analysis skills in Norway and elsewhere, and the educational systems (yours truly excepted, of course) is not responding. Good analysts are expensive. Cheap analysts – well, you get what you pay for. And, quite possibly, some analytics you may like, but not what you ought to get.
  • There is lots of data, but a shortage of models. Though you may have the data and the data scientists, that does not mean that you have good models. It is actually a problem that as soon as you have numbers – even though they are bad – they become a focal point for decision makers, who show a marked reluctance to asking where the data is coming from, what it actually means, and how the constructed models have materialised.

And with that – if you are a participant, I look forward to seeing you in February. If you are not – well, you better boogie over to BIs web pages and sign up.

The Grand Ol’ Tour

Top Gear is back (at least the one you want to watch), now called The Grand Tour, and involving the familiar three and lots of colour saturation. thegrandtourApparently, there are lots of things they cannot do that was in the old show, but this has a track, a moveable open studio, and the usual bantering and car racing. Celebrities drop in and out (quite literally.) The video quality is exceptional and the opening five minutes – apparently consuming most of the lavish budget – a kind of panoramic and unapologetic pun on just so many things. The banter seems a little bit forced in the beginning before shoulders come down and jokes get worse and worse (especially Clarkson’s.)

Very much like a comfortable old jacket and some well-worn jeans, in other words. I quite like it – it is uncomplicated, yet polysyllabic, masculine escapism. And best of all – it is included in my Amazon Prime subscription, now useful over here in Norway, too.

The boss on the boss

Born to RunBorn to Run by Bruce Springsteen

My rating: 4 of 5 stars

This book is much like a Springsteen song from the early days – long, complex and poetic language, and sometimes it can be a bit hard to hear the vocals above the “wall of sound”. But it has heart, and leaves quite a bit unsaid (and much said.) Good read, especially if you have Internet nearby and can search up the songs and bands mentioned. (Incidentally, here is a Spotify list of the 336 songs mentioned in the book: http://www.openculture.com/2016/09/he…).

An interesting twist – and something where I would have liked to read more – is Bruce Springsteen as a leader. His nickname “The Boss” comes from his ability to control and lead the bands he has been in – it has always been his bands, groups accompanying him as an artist, and I find it fascinating how he finds his self-confidence and remains in charge, working with some rather headstrong personalities. That is a management challenge I am curious to know why he undertook, and how he managed to see through.

But an interesting and very well written book. 500 pages plus, but not boring, and not more self-centered than an autobiography will have to be. Recommended.

Oh yeah – there has to be video here, methinks. This one’s good:

https://www.youtube.com/watch?v=5hj1ZqdndzU

View all my reviews

Norway and self-driving cars

(This is a translation (with inevitable slight edits) from Norwegian of an op-ed Carl Störmer (who, in all fairness, had the idea) and I had in the Norwegian business newspaper Dagens Næringsliv.)

A self-driving future

Espen Andersen, BI Norwegian Business School and Carl Störmer, Jazzcode AS

Norway should become the world’s premier test laboratory for self-driving cars.

Norway needs to find new areas of development after oil – and we should go for something the whole world wants, where we have local advantages, and where we will develop deep and important knowledge even if the original idea does not succeed. We suggest that Norway should become the world’s premier test laboratory for self-driving cars – a “moon landing” we can develop far further than what we have been able to do from our expertise in sub-sea petroleum extraction.

1280px-tesla_model_s_26_x_side_by_side_at_the_gilroy_superchargerSelf-driving cars will do for personal transportation what e-mail has done for snail mail. Tesla-founder Elon Musk says Teslas will drive themselves in two hears – they already can change lanes and park themselves in your garage. The “summon“-function (a “come here”-command for your car) could, in principle, work across the entire USA.

An electrical self-driving vehicle will seldom par, choose the fastest or most economical route, always obey the traffic laws, and emit no pollutants. A society with self-driving cars can reduce the number of cars by 70-90%, free up about 30% more space in large cities, reduce traffic accidents by 90%, and drastically reduce local air pollution.

Google’s self-driving carsgoogle_self_driving_car_at_the_googleplex have driven several million kilometers without self-caused accidents, but there are still many technical problems left to solve. The cars work well in the well marked and carefully mapped roads of sunny California. The self-driving cars drive well, but the human drivers do not. But we cannot execute a sudden transition – for a long time, human and automated drivers will have to coexist.

Norway has unique advantages as a lab. In Norway, we can develop our own self-driving cars, but also be the first nation to really start using them. We do not have our own car industry to protect, we are quick to purchase and start to use new technologies, we are such a small country that decision paths are short, and should an international company make a marketing blunder in Norway, the damage will be limited to a very small market. We can easily change our laws to allow for testing of self-driving cars: Oslo, Bergen, Trondheim and Stavanger has enough traffic issues and large enough populations to suffice for a serious experiment. As a nation, we are focused on environmental issues, innovation and employment.

Norway’s bad road standard is an advantage. Norway has plenty of snow and ice, bad weather and bad roads. Today’s self-driving cars need clear road markings to be able to drive safely. But Norway has world leading capabilities in communication and coordination technology: The oil industry has learned how to continuously position ships in rough seas with an accuracy of about five centimeters. Telenor is a world-leading company in building robust mobile phone networks in complicated terrain. Technology developed for Norwegian conditions will work anywhere in the world.

Norway needs self-driving cars more than most nations. Norway is the world’s richest and most equal country, creating a modern welfare state through automation and technology-based productivity improvements. The transportation industry is over-ripe for automation. The technology can maintain productivity growth and offer a new life for many people – the blind, the old and the physically handicapped – who do not have access to cheap and simple transportation today. It will create many jobs – think before and after the smart phone here – that can be created based on abundant and cheap transportation.

Norway will win even if we don’t succeed. Lots of new technology has to be developed to make self-driving cars from experiment to production: For instance, software has to be developed that can handle extremely complicated situations when autonomous cars will have to share the road with tired human drivers. More importantly, lots of products and services can be built on top of self-driving cars, business models have to be developed, and many industries will be impacted. The insurance business, for instance, will have to adapt to a market with very few accidents. Even the donor organ market will be impacted – though traffic accident organs by no means make up the majority of organs available, there might be a shortage of available organs.

Norway has faced tremendous changes before. We have transited from being harvested ice to electric refrigertation (in the process enabling our large fishing and fish farming industries), from sail to steam shipping, from fixed line telephony to mobile phones. Our politicians have, quite wisely, created an electric car policy ensuring that we have the highest density of electric cars in the world (10% of all Teslas are sold in Norway.) Norway has everything to earn and very little to lose by going all in for self-driving cars.

Let’s do it!

All the cargo in the world…

I just love this map, created by Kiln, so I wanted it on my blog for easy reference:

It is rather fascinating, and clearly shows why Singapore has acquired such an important position in the world’s logistics. Click on the play button in the top right corner for a short narration. The data is from 2012, but the pattern is largely the same today.

Does someone have to die first?

double-classroomBlogpost for ACM Ubiquity, intro here:

Digital technology changes fast, and organizations change slowly: First using the technology as an automated, digitized version of the old way of doing things, then gradually understanding that in order to achieve productivity and functional breakthroughs. We need to leave the old metaphors behind. For this to happen, we need new mindsets, unfettered by the old way of using the technology. I wonder if my generation has the capability to do it.

Read the rest at ACM Ubiquity: Does someone have to die first?

Cases: How to prepare for and learn from them

My versatile and creative colleague Hanno Roberts and I have made a series of five videos on case learning and preparation, originally for students at the BI/Fudan MBA program. This teaching method is difficult both for teacher and student, but highly rewarding provided you give it proper attention – which means effective preparation. Hanno and I talk about the goal of case teaching, how students can prepare individually, how to prepare as a group, how to go through the case discussion in the classroom, and then we sum up with some strategies for how to retain what you have learned.

Hanno and I did these videos against a green-screen, with little preparation – we basically met, outlined a structure with some keywords, decided broadly on who should say what, and dove right into it. Most of the videos were shot once, and then the very capable Milosz Tuszko edited them, added background, logos and keywords.

The updated videos are a less wooden than the previous version, methinks, and available in high resolution and with better sound. We clarified the differences between my version of case teaching and Hanno’s (both work, by the way). Over the years the original videos have been much watched – hopefully, our students (and others) will watch them carefully, and the result will be better case teaching, more learning, and an even more enjoyable experience teaching.

Details about each video below the fold…

Continue reading

Top Gear II

OK, so they got horrible reviews (at least in Norway). Chris Evans needs to reduce his dosage a bit. Matt LeBlanc could actually be cool if he upped his celebrarity (is that a word?) a bit. Well, “appeared more intelligent” would be more precise.

Nothing about this program that hiring Stephen Fry as a third host wouldn’t fix….