I am starting a new executive course, Analytics for Strategic Management, with my young and very talented colleagues Alessandra Luzzi and Chandler Johnson (both with the Center for Digitization at BI Norwegian Business School).

Alessandra Luzzi

Chandler Johnson
The course (over five modules) is aimed at managers who want to become sophisticated consumers of analytics (be it Big Data or the more regular kind). The idea is to learn just enough analytics that you know what to ask for, where the pressure points are (so you do not ask for things that cannot be done or will be prohibitively expensive). The participants will learn from cases, discussions, live examples and assignments.
Central to the course is a course analytics project, where the participants will seek out data from their own company (or, since it will be group work, someone else’s), figure out what you can do with the data, and end up, if not with a finished analysis (that might happen), at least with a well developed project specification.
The course will contain quite a bit of analytics – including a spot of Phython and R programming – again, so that the executives taking it will know what they are asking for and what is being done.
We were a bit nervous about offering this course – a technically oriented course with a February startup date. The response, however, has been excellent, with more than 20 students signed up already. In fact, wi will probably be capping the course at 30 participants, simply because it is the first time we are teaching it, and we are conscious that for the first time, 30 is more than enough, as we will be doing everything for the first time and undoubtedly change many things as we go along.
If you can’t do the course this year – here are a few stating pointers to whet your appetite:
- Big Data is difficult to define. This is always the case with fashionable monikers – for instance, how big is “big”? – but good ol’ Wikipedia comes to the rescue, with an excellent introductory article on the concept. For me, Big Data has always been about having the entire data set instead of a sample (i.e., n = p), but I can certainly see the other dimensions of delineation suggested here.
- Data analytics can be very profitable (PDF), but few companies manage to really mine their data for insights and actions. That’s great – more upside for those who really wants to do it!
- Data may be big but often is bad, causing data scientists to spend most of their time fixing errors, cleaning things up and, in general, preparing for analytics rather than the analysis itself. Sometimes you can almost smell that the data is bad – I recommend The Quartz guide to bad data as a great list of indicators that something is amiss.
- Data scientists are few, far between and expensive. There is a severe shortage of people with data analysis skills in Norway and elsewhere, and the educational systems (yours truly excepted, of course) is not responding. Good analysts are expensive. Cheap analysts – well, you get what you pay for. And, quite possibly, some analytics you may like, but not what you ought to get.
- There is lots of data, but a shortage of models. Though you may have the data and the data scientists, that does not mean that you have good models. It is actually a problem that as soon as you have numbers – even though they are bad – they become a focal point for decision makers, who show a marked reluctance to asking where the data is coming from, what it actually means, and how the constructed models have materialised.
And with that – if you are a participant, I look forward to seeing you in February. If you are not – well, you better boogie over to BIs web pages and sign up.

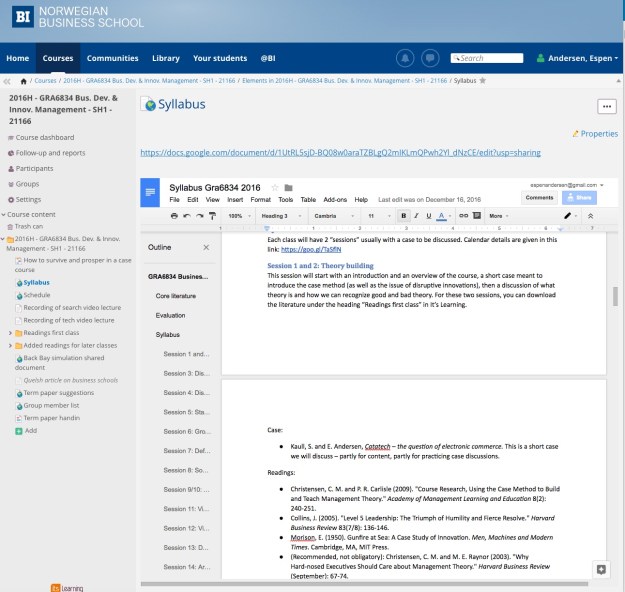
 The hack, of course, is simple: Write next year’s course documentation as you are teaching this year’s course. For instance: I have a detailed syllabus (written as a Google Doc) for my course GRA834 Business Development and Innovation Management (which I last taught in the fall of 2016). The syllabus is largely the same from year to year, but when I start teaching the course, I make a new copy of document (as the figure shows, the whole course folder), and fiddle with it after each class. For stuff I will have to change later, I make a note to myself, inserting the text “zxzx” which I can search. When the course starts next year, I simply make the edited documents available to the students straight into It’s Learning (the course management system we use at BI.)